How to backtest liquidity sweeps with bar replay
Turn “price swept the lows” into rules a stranger could follow, then test them candle by candle without hindsight.
Short answer
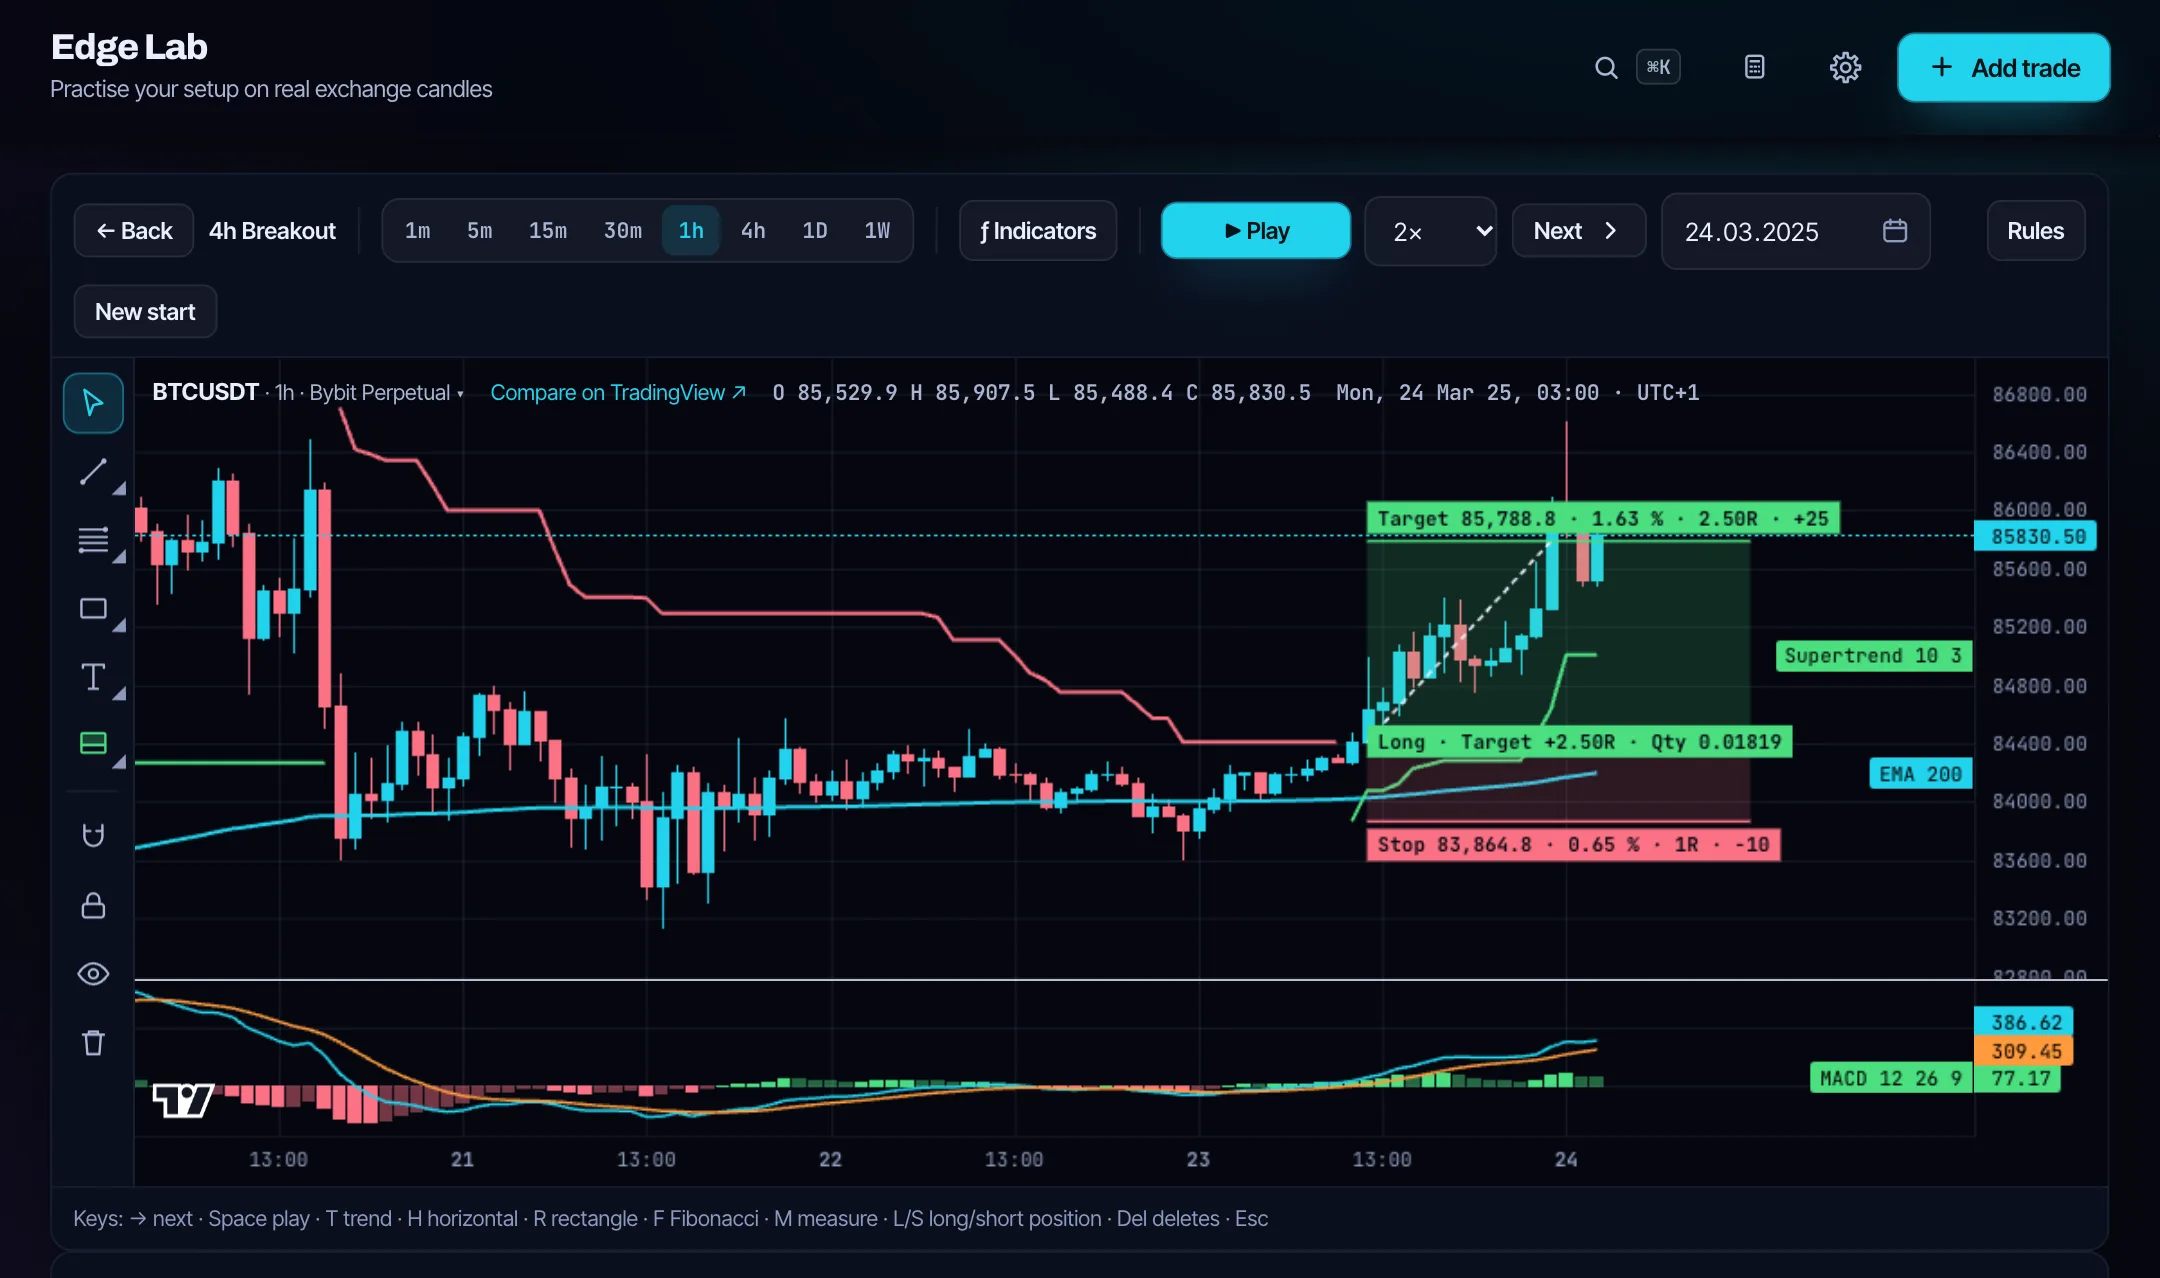
To backtest liquidity sweeps, first define a sweep so that two people would mark the same candles: a fixed level (for example the previous day’s high or low), a trigger distance beyond it and a rule for how soon price has to close back inside. Then replay from random start dates with the future hidden, take every sweep that meets the rules, and log each trade with its R. In Edgetrail you can draw the previous day high and low (PDH/PDL) and the Tokyo, London and New York sessions on the replay chart, and every replay trade lands in the backtest journal of your system. A sweep is a pattern, not an edge: whether it pays only shows after a few hundred trades.
Define a sweep before you look at a chart
“Liquidity sweep” describes a move that runs beyond an obvious level, where stop orders are likely to sit, and then reverses. As a description it is fine; as a test rule it is useless, because almost every reversal can be called a sweep afterwards. A testable definition has three parts and a few fixed choices:
| Rule | Written so that anyone gets the same answer | Example (short after a sweep of the high) |
|---|---|---|
| Level | previous day high or low, days from 0:00 UTC (as Edgetrail draws PDH/PDL) | PDH 61,240 |
| Trigger | price trades at least 0.05% beyond the level | high 61,410, 0.28% above |
| Close back inside | a 15-minute candle closes back inside the previous day’s range within 2 candles of the trigger | close 61,180, below the PDH |
| Session filter | only during the London or New York session (optional, but decide before you start) | London session |
| Entry | market order at the open of the next candle | 61,170 |
| Stop | sweep extreme plus a fixed buffer (40) | 61,450 (risk 280) |
| Target | 2 R, no discretion | 60,610 |
Illustration with round BTC prices, not a real date and not a result. The numbers in the right-hand column are computed from the rules.
Step by step in Edgetrail’s replay
- Create a system for the setup and write the rules from the table into it, so every replay trade is measured against one fixed rule set.
- Pick the market and timeframe. Replay runs on Bybit, Binance, OKX and Coinbase candles from 1 minute to 1 week; use the timeframe you would trade, for example 15 minutes.
- Add the overlays. Turn on PDH / PDL – days start at 0:00 UTC, as usual for crypto, and only complete days are drawn – and Sessions (Tokyo 9:00–18:00, London and New York 8:00–17:00, each in that city’s local time, shown up to 1-hour candles). Previous week high and low and the day, week and month opens are available too if your rules use them.
- Press “Random start”. Edgetrail picks a date between about three years and two months back, so you don’t know whether the next day is a trend or a range. Future candles stay hidden until you step forward.
- Step forward and mark. When price trades through the level by the trigger distance, watch the next candles. Only if a candle closes back inside within the allowed number of candles is it a sweep. Your own drawings help to keep the level visible.
- Draw the position with entry, stop and target exactly as the rules say. Edgetrail fills it from the real candles; when stop and target fall in the same candle, it checks the 1-minute candles, and if that is still unclear the stop counts (details in stop and target in the same candle).
- Repeat from a new random start until you have enough trades, across several months and market phases.
How often does a sweep even happen?
Before you spend hours on replay, check the base rate: how often does price take the previous day’s high or low at all, and how often does it close back inside afterwards? The data study how often BTC takes the previous day’s high or low measures this on real Bitcoin candles. A rule that triggers on most days needs a filter (session, trend, distance); a rule that triggers twice a month needs a very long test period to reach a usable sample.
How many trades you need
Sweep setups usually have win rates below 50% with winners of 2 R or more, and that profile needs a large sample. In our reproducible simulation a system that truly wins 40% of trades at 2 R (true expectancy +0.20 R) still shows zero or negative expectancy in 9.0% of 100-trade samples, and needs about 208 trades before the 95% interval stays above zero. The method and the full table are in how many trades a backtest needs.
Recording the results
Every replay trade lands in the backtest journal of the system with its R, and the journal shows expectancy, profit factor, win rate and drawdown for the setup, measured the same way as live trades. Replay R is without fees, slippage and funding, so take your costs off before you compare: at 0.1 R costs per trade a 2 R target is really 1.9 R and a stop costs 1.1 R. The risk/reward calculator shows the breakeven win rate for your target, and what a good profit factor is gives honest ranges. Terms such as liquidity sweep and expectancy are defined in the glossary.
Common mistakes
- Marking sweeps after the reversal. If the definition needs the next hour to be confirmed, the entry must come after that hour too.
- Moving the level. “The real high was the wick, not the body” decided case by case is hindsight. Pick one and keep it.
- Skipping the ugly ones. Sweeps that run straight through and keep going are part of the setup. Leaving them out is the most common reason a sweep backtest looks better than live trading.
- Stops too tight for the timeframe. A stop a few ticks above the sweep high puts stop and target in one candle often, and the stop-first rule then decides many trades.
- Testing only BTC in one year. Replay other markets and other phases before trusting a number.
If you are still choosing a tool for this, the checklist for crypto backtesting software covers exchange data, 1-minute depth and fill rules.
Replay runs on real candles from Bybit, Binance, OKX and Coinbase – 4,952 crypto markets as of 4 November 2026, from 1-minute to weekly candles. For Bitcoin, 1-minute history goes back to 20 July 2015 (BTC-USD on Coinbase). Edgetrail costs $24 a month or $199 a year; the first 50 Founders pay $99 once, after that a Lifetime plan costs $249 once. The first 14 days are free without a credit card, and every payment comes with a 14-day money-back guarantee.
Updated:
Frequently asked questions
What is a liquidity sweep in trading?
A move that trades beyond an obvious level such as the previous day’s high or low, where stop orders are likely to sit, and then closes back inside it. For a backtest it needs a fixed level, a trigger distance and a close-back-inside rule.
Can you backtest liquidity sweeps automatically?
Only if every part of the definition is exact, such as the level, the trigger distance and the number of candles to close back inside. Edgetrail’s backtesting is manual bar replay, so you apply those rules yourself candle by candle.
Which levels can Edgetrail draw on the replay chart?
Previous day high and low, previous week high and low, the day, week and month opens, VWAP, volume and the Tokyo, London and New York sessions. Days start at 0:00 UTC.
Are liquidity sweeps profitable?
That is exactly what a backtest has to show, and the answer depends on your rules, market and costs. A pattern that looks convincing on a few charts can still have zero or negative expectancy over a few hundred trades.
Keep reading
$24 a month · $199 a year · $99 once as a Founder (50 spots) · later $249 Lifetime. The first 14 days are free, no credit card.
All pricesReady to face your numbers?
Log your first trade in minutes. 14 days free, no credit card.
Try free for 14 days