- Home
- Methodology
How Edgetrail calculates P&L, fees, R and statistics
Every formula the journal uses, taken from the app’s code, with worked examples – plus the rules for our comparison pages.
Short answer
Edgetrail calculates every trade per exit: net P&L = gross × conversion rate − exit fee − the exit’s share of the entry fee, summed and rounded to eight decimal places; R = net P&L ÷ risk at the initial stop. Statistics (win rate, profit factor, expectancy, average R) use only fully closed trades in your account currency, while realised P&L, the equity curve, drawdown and the prop firm limits count every exit on the day it happens. Nothing is estimated: a missing exchange rate or price leaves a trade out and says so.
The trade model
A trade in Edgetrail has exactly one entry (price, size, point value, optional stop and target) and any number of exits. Each exit has its own size, date, time and fee – and either a price or a gross amount (how to log scaling out is shown in how to journal partial exits). A trade is open without exits, partly open while the exits add up to less than the entry size, and closed when they match. If the exits add up to more than was opened, the trade is flagged and left out of every number until the size is fixed.
There are two ways to record a result:
- From the exchange (net): you enter the realised P&L exactly as the exchange shows it. Edgetrail books it unchanged; the fee you enter there is information only, because the exchange has already deducted it. This is the default for imported and quickly logged trades.
- Calculate from prices: Edgetrail calculates the result from entry, exit, size, point value and fees, using the formulas below.
P&L per exit, step by step
- Gross = (exit − entry) × exit size × point value for a long, (entry − exit) × exit size × point value for a short – or the gross amount you entered instead of a price.
- Conversion: if the trade currency differs from the account currency, gross is multiplied by the rate you entered for that exit (1 unit of trade currency in account currency).
- Exit fee in one of two modes: an amount you enter, or a percent per side, calculated on the exit’s position value (price × size × point value) at the exit’s rate.
- Entry fee share: the entry fee (amount, or percent of the entry position value at the entry rate) is split across the exits by size: entry fee × exit size ÷ total size.
- Net of the exit = gross × rate − exit fee − entry fee share.
- Net of the trade = sum of all exits, rounded to eight decimal places. A negative fee is treated as a credit, for example a rebate.
Amounts are displayed with two decimals; amounts under 1 get as many decimals as needed (up to eight) so that small crypto results never collapse to 0.00. Calculation always uses the full value.
Risk and R
Risk = |entry − stop| × size × point value × rate at entry – or the “risk at stop” amount you enter, which takes priority. A stop on the wrong side of the entry gives no risk. R = net P&L of the closed trade ÷ risk, so fees are part of R. R is shown with two decimals. An R beyond ±50 is almost always an input error (a stop next to the entry, a size in the wrong unit), so it is not counted silently: the trade shows “Check R” and stays out of the average R. Planned R:R = |target − entry| ÷ |entry − stop|. Deviation from plan = the price difference of each exit to the target (for winners) or to the stop (for losers), in account currency without fees.
Worked examples
Futures with a point value and two exits
Long 2 contracts at 5,000, stop 4,990, point value 50, entry fee $4.50 in total, $2.25 per exit. First exit 1 contract at 5,012.5, second 1 contract at 5,020.
- Exit 1: gross (5,012.5 − 5,000) × 1 × 50 = $625.00; net 625.00 − 2.25 − 4.50 × (1 ÷ 2) = $620.50.
- Exit 2: gross $1,000.00; net 1,000.00 − 2.25 − 2.25 = $995.50.
- Trade: net $1,616.00, fees $9.00, risk |5,000 − 4,990| × 2 × 50 = $1,000.00, R = 1,616.00 ÷ 1,000.00 = +1.62 R.
A trade in a foreign currency
Account in EUR, stock bought in USD: long 100 at 200 USD, stop 195, exit 210, fee 0.1% per side. Rate at entry 0.92 EUR per USD, at exit 0.93 (rates you enter, illustration).
- Entry fee = 0.1% × 20,000 USD × 0.92 = 18.40 EUR; exit fee = 0.1% × 21,000 USD × 0.93 = 19.53 EUR.
- Gross = 10 × 100 = 1,000 USD × 0.93 = 930.00 EUR; net = 930.00 − 19.53 − 18.40 = 892.07 EUR.
- Risk = 5 × 100 × 0.92 = 460.00 EUR (at the entry rate); R = +1.94 R.
A result taken from the exchange
Short 1.5 ETH; the exchange shows a closed P&L of −42.17 USDT, of which 3.10 USDT fees. Edgetrail books −42.17 USDT unchanged and shows −39.07 USDT as gross (net + fees) for information. Nothing is recalculated.
Statistics
Win rate, profit factor, expectancy, average win and loss, best and worst trade and average R use only fully closed trades in the current account currency. Breakeven trades (net exactly 0) count in the number of trades but are neither winners nor losers. Expectancy in money = net result ÷ closed trades; average R uses only closed trades with a stop or risk amount and says how many that are (“from n trades with a stop”). A profit factor with no losing trades is shown as ∞. Realised P&L, the equity curve, the calendar and maximum drawdown count every exit in time order, including exits of partly open trades. Maximum drawdown is measured on the running total of realised results, starting at 0; if you enter your account balance, the analytics page also shows it in percent from the peak.
| Number | Example result | Formula in the app |
|---|---|---|
| Win rate | 4 ÷ 10 = 40.0% | winners ÷ closed trades (breakeven counts in the total) |
| Profit factor | 560 ÷ 285 = 1.96 | gross profit ÷ gross loss |
| Expectancy | 275 ÷ 10 = +$27.50 | net result ÷ closed trades |
| Average win / loss | $140.00 / −$57.00 | gross profit ÷ winners; gross loss ÷ losers |
| Max drawdown | −$180 | deepest fall of the running total below its previous high, starting from 0 |
| Longest losing streak | 3 | losers in a row by closing time; breakeven neither extends nor breaks |
| Current streak | 1 loss | same rule, counted back from the last closed trade |
Ten closed trades, net results in closing order: +120, −60, −60, 0, −60, +200, +90, −60, +150, −$45. Running total: 120, 60, 0, 0, −60, 140, 230, 170, 320, 275. Illustration, computed with the app’s formulas.
Sample sizes and what is hidden
- Every average comes with the number of trades it is based on.
- In the analytics tables (weekday, hour, holding time, rules, mistakes, emotions) groups with fewer than 3 trades are faded and show no averages; groups under 20 trades carry a “thin sample” mark.
- The strongest and weakest context (system, asset, direction, market condition, timeframe) needs at least 5 trades per group; results usually become reliable from about 20.
- The comparison of days with and without a written morning analysis appears only with at least 10 days on each side, and it is labelled as a correlation, not proof.
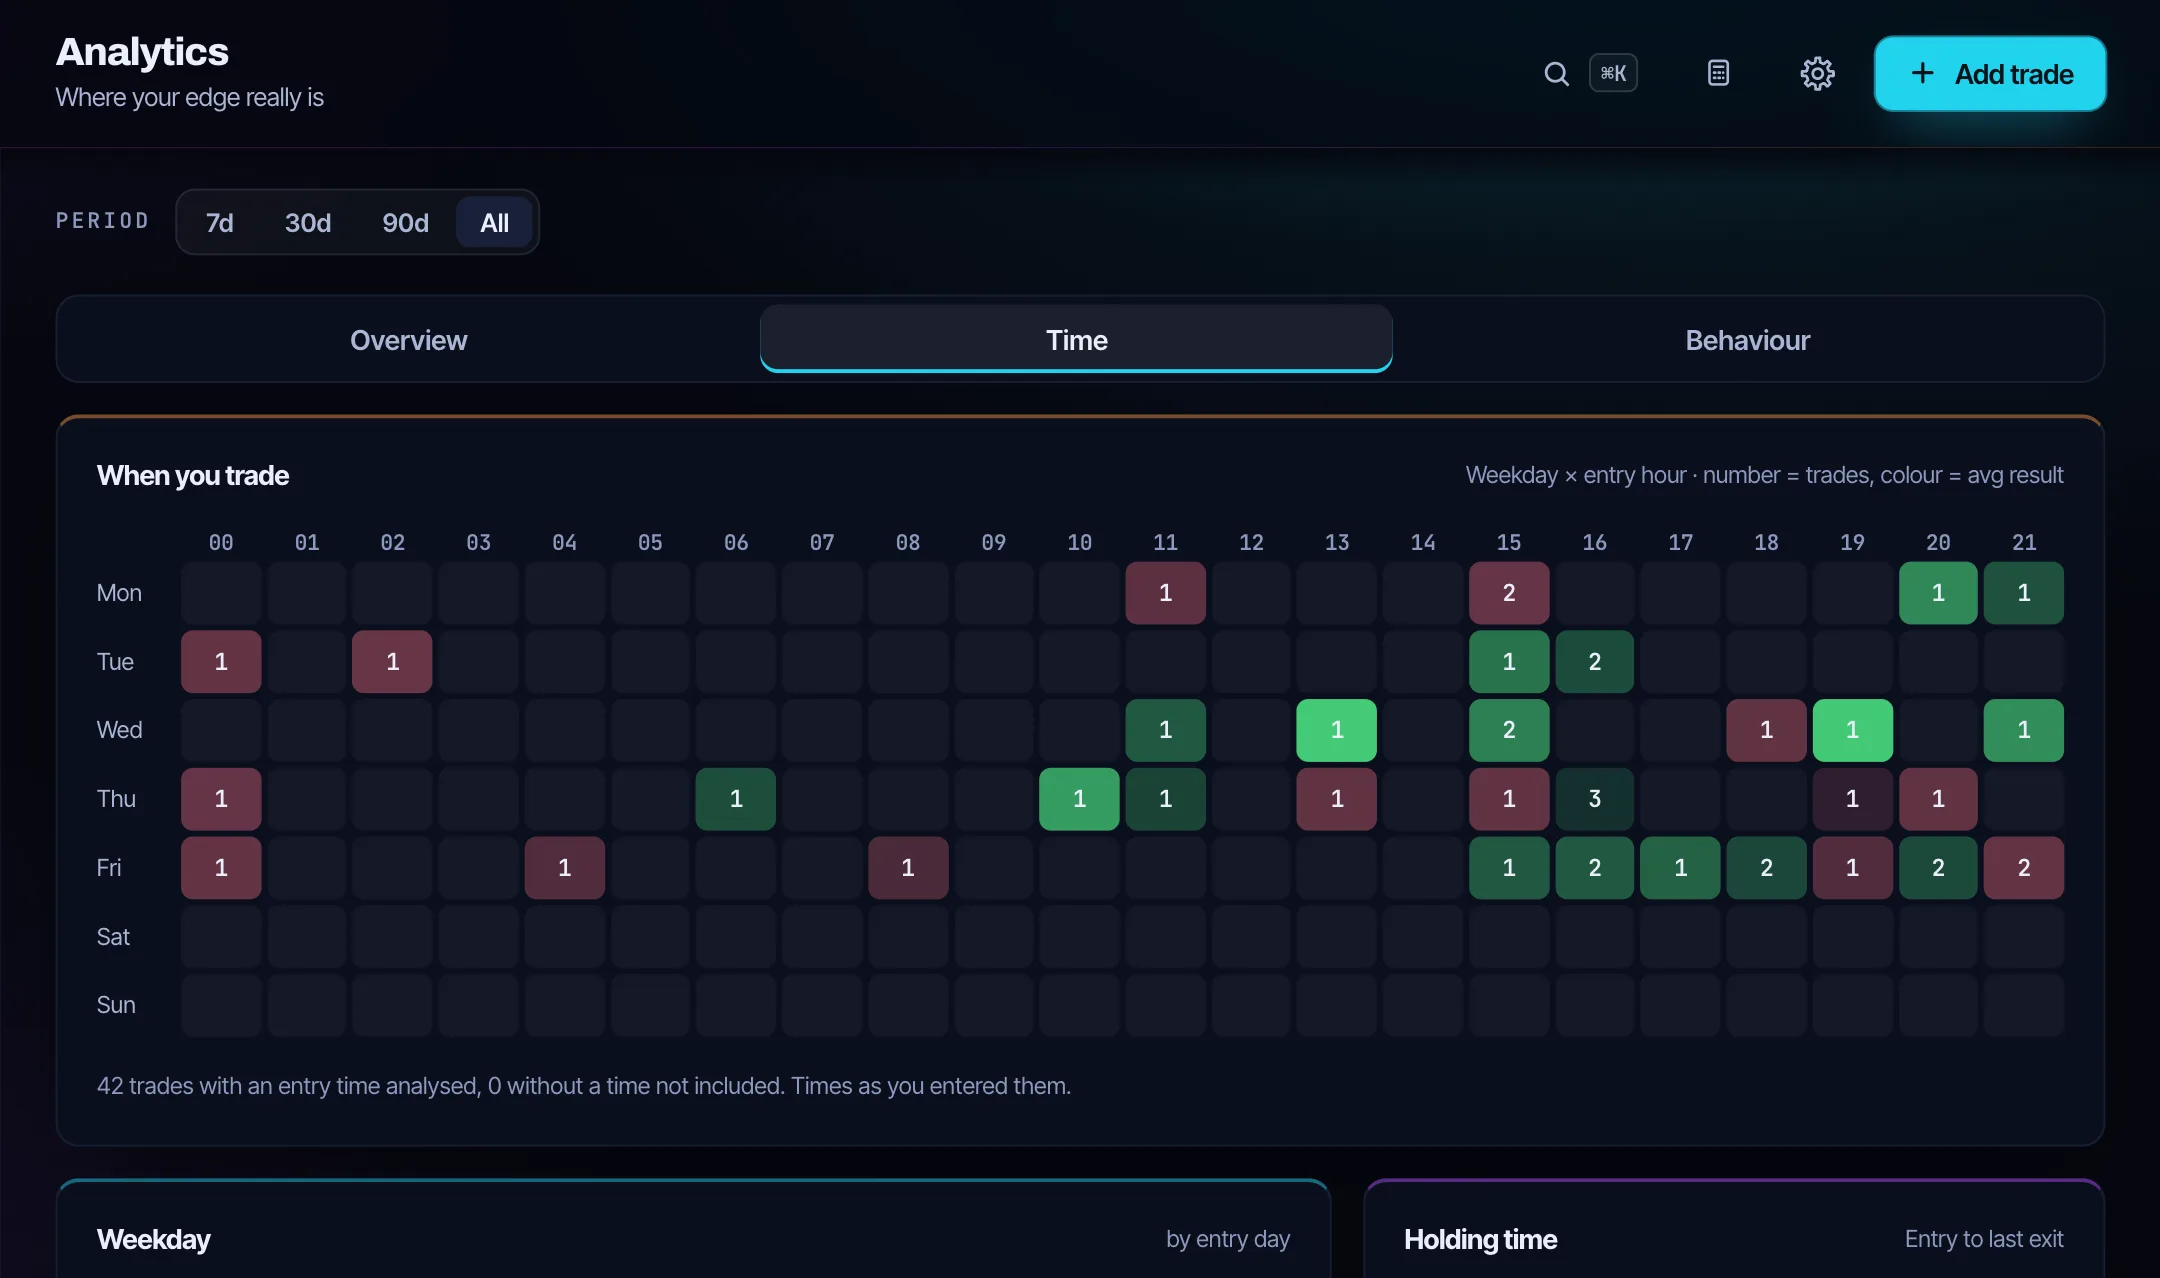
- Imported trades without an entry time are left out of weekday and holding-time tables, and the page says how many.
How large a sample has to be before a number means something is shown with a simulation in how many trades a backtest needs.
Currencies, days and time
- Account currency: statistics only add up trades of the account currency you are looking at. Trades of other accounts are counted and named in a note, never converted silently.
- Exchange rates: a trade in another currency needs a rate at entry and one per exit. Edgetrail can fetch the European Central Bank reference rate for the date on request (via frankfurter.dev), and you can overwrite it with the rate from your statement. Without a rate the trade is not counted and the note says how many are missing.
- Days: a closed trade belongs to the day of its last exit; each exit is booked on its own date in the calendar and the equity curve. Days follow your device’s local midnight. Imported exchange timestamps are converted to your device’s local time.
Prop firm mode
The prop firm mode replays every realised exit since the challenge start date in time order. Daily loss = the sum of a day’s exits against the limit in percent of the account size. Static drawdown floor = account size − limit; trailing floor = min(highest closed balance − limit, account size), updated after every exit. Open positions are not counted – the firm usually counts them, so the app says so. Warnings appear at 75% and 100% of each limit. The same floors are in the free drawdown calculator and explained in trailing vs static drawdown.
Imports and replay
- Exchange and CSV imports create trades “from the exchange”: the realised P&L as the exchange reports it, fees as information. Which exchange includes funding in that number is listed in crypto futures P&L with fees and funding.
- Replay trades are booked in R against the initial stop, without fees, slippage or funding, into the backtest journal of the system. Their expectancy is the average R, the drawdown is measured in R and the losing streak uses the same breakeven rule as the journal. Fills are simulated from real candles: when stop and target fall in the same candle, 1-minute candles decide, and if that is still unclear the stop counts – worked through in stop and target in the same candle.
Editorial policy for comparisons and guides
- Sources: every price and feature of another product links the seller’s own page, marked rel="nofollow" as evidence, not as a recommendation.
- Dates: every comparison states when the facts were checked; competitor prices on the current pages were checked on 9 October 2026. Each page shows the date it was last updated.
- Where others are better: every comparison has a section that names what the other product does better, and the roundups say openly that they are written by the team behind Edgetrail.
- No affiliate links: Edgetrail earns nothing from any link on this site, and no product pays to be listed.
- Edgetrail facts come from the app’s code and from measurements; features that are not live are not described. Illustrations are labelled as illustrations, and calculated examples use the app’s own formulas.
- Corrections: if a fact is wrong, write to support and the page is corrected with a new date.
- Product changes are listed with their date in the changelog; the checked facts about Edgetrail itself – markets, prices, company – are in the press kit.
Updated:
Frequently asked questions
Does Edgetrail include fees in R?
Yes. R in the journal is the net result after fees divided by the risk at the initial stop, so a trade that hits a 2R target shows slightly less than 2R. Replay trades are the exception: they are booked in R without fees.
How does Edgetrail handle partial exits?
Each exit is booked on its own day with its own fee and its share of the entry fee. The trade enters win rate, profit factor and R only when the exits add up to the entry size.
Are breakeven trades counted in the win rate?
They count in the number of trades but not as winners or losers, so they lower the win rate slightly. They neither extend nor break a winning or losing streak.
Does Edgetrail convert currencies automatically?
No. A trade in another currency needs a rate at entry and per exit. Edgetrail can fetch the ECB reference rate on request, and without a rate the trade is left out and named in a note.
Does Edgetrail use affiliate links in its comparisons?
No. There are no affiliate links on the site and no product pays to be listed; prices link the sellers’ own pages with the date they were checked.
Keep reading
$24 a month · $199 a year · $99 once as a Founder (50 spots) · later $249 Lifetime. The first 14 days are free, no credit card.
All pricesReady to face your numbers?
Log your first trade in minutes. 14 days free, no credit card.
Try free for 14 days